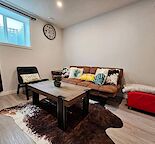
Apartments for rent in Riverbend, Calgary
Rental data, transit access, amenities, and a composite Rentvoy rating of 51/100 for Riverbend, Calgary. Updated 2026-08-30.
Overview
Riverbend is a quieter residential pocket of Calgary where parks and green space outnumber commercial strips — a trade-off that suits renters who prioritize space over transit frequency. The Rentvoy composite lands at 51/100 — Calgary Transit coverage is sparse (47 walkshed stops) so most households rely on a car, and parks cover roughly 18% of the neighborhood area. The 2019 civic census counted roughly 9,244 residents — a medium-sized community by Calgary standards. The average residential assessment in Riverbend is about $636,191 — mid-range for Calgary — which is useful context for rent expectations even though actual rent depends on unit type and building. Safety is held at a neutral 50 placeholder until CPS crime statistics become machine-readable; every other figure on this page is live open data.
Rentvoy rating: 51/100
| Factor | Score | Source |
|---|---|---|
| Transit (walkshed) | 35/100 | Calgary Transit stops per km² within polygon + 400m buffer |
| Amenities | 49/100 | Parks + schools + rec + attractions per km², polygon + 1 km walkshed |
| Walkability | 52/100 | Road intersection density (114.32/km²) |
| Green space | 73/100 | Park area / community area (18% coverage) |
| Safety | 50/100 | CPS crime stats (placeholder — see below) |
Property values in Riverbend sit in the mid-range band citywide (avg assessed value $636,191). Value data is shown as context, not mixed into the rating — it's an ownership figure, not rent.
Live rentals in Riverbend
See current listings for Riverbend on our search page.
Frequently asked questions
What is the average assessed property value in Riverbend?
The City of Calgary's most recent residential property assessment shows an average assessed value of $636,191 for Riverbend — in the mid-range band citywide. Property assessment reflects ownership costs, not rent; actual monthly rent varies by unit type, building, and availability.
How is transit in Riverbend?
Riverbend has 27 Calgary Transit stops inside the community polygon and 47 stops total within a 400m walkshed (5-minute walk of the boundary). Spread over the 7.918 km² that walkshed covers, that is 5.94 stops per km², for a transit sub-score of 35/100 against a saturation of 17 stops/km². The score uses the density rather than the raw count so that a large community is not credited for stops nobody can walk to from any one address.
What is walkable from Riverbend?
Within 1 km of the community we count 29 parks, 2 schools, 1 recreation facilities, and 3 attractions — 35 walkable points of interest in total, or 2.2 per km² across the 15.933 km² that walkshed covers. That density gives an amenities sub-score of 49/100.
How walkable is Riverbend?
Riverbend has 438 road intersections across 3.831 km² — a density of 114.32 intersections per km². That drives a walkability sub-score of 52/100, benchmarked against a saturation of 220 intersections/km² (dense routable grid). Intersection density is a standard proxy for walkable block size.
How much green space does Riverbend have?
About 18% of Riverbend's land area is covered by parks (0.703 km² of park inside a 3.831 km² neighborhood, based on the City of Calgary parks dataset). That produces a green space sub-score of 73/100, benchmarked against 25% coverage as saturation — neighborhoods above that are effectively park-first environments with residential woven through.
Is Riverbend a good place to rent?
Rentvoy's composite rating for Riverbend is 51/100, blending walkshed transit (25%), walkable amenities (25%), walkability from intersection density (20%), green space coverage (20%), and safety (10%, neutral placeholder pending CPS crime data). Individual priorities vary — use the rating breakdown to see which factors align with your needs.
Data transparency
Rentvoy's Riverbend rating is deterministic — every figure on this page comes from the City of Calgary Open Data Portal and is recomputed when the underlying data refreshes. No subjective weighting is applied on top of the published formula.
Why densities, not counts: transit and amenity sub-scores divide by the area their walkshed actually covers. Counting alone would rank a community highly for being large — a 400 m walkshed around a 5 km² polygon sweeps up three times the bus stops of one around a 1.6 km² polygon, for exactly the same walk from any front door. The raw counts are still printed above, because they are the honest answer to "how many are there"; the score answers "how close together".
What's not in the score yet: The Calgary Police Service publishes community crime statistics, but the current-year table on the open data portal is access-restricted rather than public, so our safety sub-score holds a neutral 50 placeholder rather than depend on a feed we cannot re-read on every refresh. This is called out on every community page so readers can factor it in. When CPS publishes an open JSON or CSV feed we can re-read on every refresh, we'll replace the placeholder and regenerate every page in a single ingest pass.
What property value means here: The average assessment figure is an ownership-cost proxy, not rent. It's included as context because expensive-to-own neighborhoods typically rent higher, but actual rent in Riverbend varies widely by building, unit size, and availability. Live listings will always reflect the real number.
Data sources
- Community district boundaries
- Calgary Transit stops
- Parks sites
- Schools
- Recreation facilities
- Community services
- Street centreline (intersections derived)
- Property assessments
- Census by community (2019)
Data snapshot: 2026-08-30. Rentvoy combines City of Calgary open data with live listings on our platform.